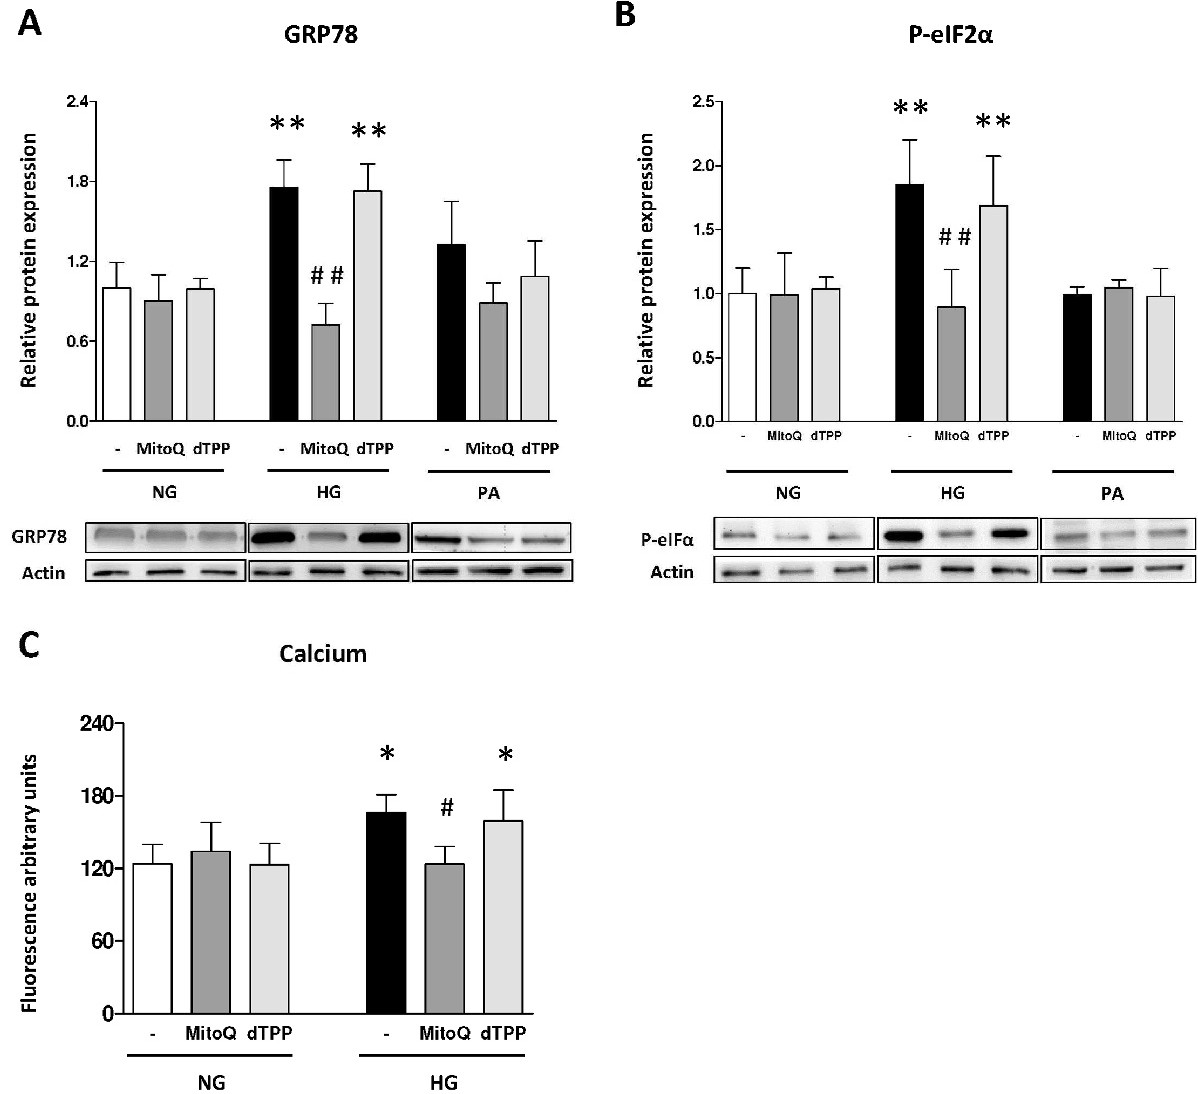
Fig. 4. Evaluation of endoplasmic reticulum stress markers in pancreatic β cells under normoglycaemia, hyperglycaemia and lipidic conditions in the presence and absence of MitoQ (3h, 0.5µM). (A) Protein levels of GRP78 and representative WB images. (B) Protein levels of P-eIF2α and representative WB images. (C) Levels of intracellular calcium measured as Fluo-4 AM fluorescence by fluorometry. *p<0.05 and **p<0.01 with regard to control in normoglycaemia. #p<0.05, ##p<0.01 when comparing groups treated and not treated with MitoQ in the hyperglycaemia condition (data represented as mean ± S.E.M, n=6).